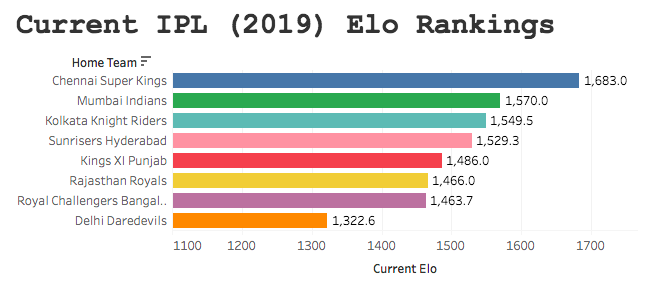
Below you will find a hypothetical list of fixtures, the difference in current Elo rankings between the two teams and the probability of the home team winning based on these rankings. It is important for me to reinforce all of the above with some caveats, before I discuss how I modelled this data. On the point of this being current Elo rankings, that means as of the end of the 2019 campaign, so in theory all of these fixtures would have to be on the very first day of the season, as their Elo rankings will deviate based on how they actually begin the campaign (when the season is actually underway, I will build out a dynamic version of below, which will aggregate actual win-losses). The same goes for the probabilities; as these were computed by mapping the difference in Elo rankings between teams, the probabilities I modelled out will also shift as teams win and/or lose throughout next season. Finally, all of the hypothetical fixtures presented are from the teams that competed in the most recent IPL campaign, whilst the data used for the model is from all IPL fixtures, regardless of the team (given how the IPL has been so far, I wouldn’t be surprised if new teams appear or some current teams fold). The data used for the probabilities below, was modelled using the Elo scores I computed.
The Model
The build process for the model I used was fairly simple. All it entailed was mapping the outcome of every match since 2008 against the difference in Elo between each team. There was data that needed to be manually excluded; for instance, the first eight fixtures of the 2008 campaign – as there was often no difference in Elo points, as teams were still on the predetermined (and somewhat arbitrary) 1500 points. The same goes for teams that joined the league at later stages; the Kochi Tuskers Kerala for instance, had a cameo appearance in 2011 and although some of their data was included in the model, this was once they had gained “some” traction (i.e. their Elo score had deviated from baseline).
A binary logistic regression, was used for modelling the data with the lgm() function in R. All this entails is assigning a [1] to a victory and a [2] to a loss, and the difference in Elo points between the two teams prior to their encounter. This wasn’t too labour-intensive, as in order to calculate Elo points, you have to assign victories and losses in a binary fashion anyhow; this makes running the regression straight forward; which should look as such: y (binary outcome of the match) ~ x (difference in Elo ranking prior to match)
Findings
The probabilities from below present a few questions. Firstly, it seems that there really are no “dead certs”, when using Elo as your sole predictor of match outcome. What this suggests is three-fold. Firstly, it may be the K Value assigned in my initial Elo calculations was too conservative, perhaps IPL win-streaks are a better indicator in determining the season and potentially Elo needs to reflect this by having a more responsive mediator (this will in turn make the difference between better and worse teams greater, thus increasing winning probabilities). Secondly, the % of Elo carried over in consecutive seasons may also be too conservative, it may be that its an unfair penalty to those teams that finished a season strongly to take away some of their hard work; it could be that this is under-representing the true difference in Elo between the better and worse teams. Finally, compared to other Elo models, the IPL dataset is quite small. This is because the league has only been around for 11 years. Although there are still ~900 data points in the model, what this means is that the data of the earlier years of the IPL could be under-representing true differences between teams. In essence, in the earlier years of IPL competition, performance was more varied, as teams were finding their feet in the league; as Elo ratings from these years is (in some part) carried over from year to year, this will in turn effect Elo differences and win probabilities. Later work will look at segmenting year-by-year performance, because the first few years of the IPL could be skewing the model.
| Home Team | Away Team | Difference in Elo Points | Win Probability |
| Chennai Super Kings | Delhi Capitals | 227.4 | 73.0% |
| Mumbai Indians | Delhi Capitals | 202 | 67.6% |
| Mumbai Indians | Rajasthan Royals | 196 | 62.4% |
| Mumbai Indians | Kolkata Knight Riders | 142 | 62.3% |
| Chennai Super Kings | Royal Challengers Bangalore | 252.7 | 60.8% |
| Chennai Super Kings | Kings XI Punjab | 150.5 | 60.0% |
| Chennai Super Kings | Rajasthan Royals | 221.5 | 60.0% |
| Chennai Super Kings | Sunrisers Hyderabad | 196.2 | 58.4% |
| Mumbai Indians | Royal Challengers Bangalore | 227 | 58.3% |
| Mumbai Indians | Sunrisers Hyderabad | 171 | 57.9% |
| Chennai Super Kings | Kolkata Knight Riders | 167.2 | 57.1% |
| Mumbai Indians | Kings XI Punjab | 125 | 55.3% |
| Kings XI Punjab | Royal Challengers Bangalore | 102 | 54.3% |
| Kolkata Knight Riders | Royal Challengers Bangalore | 85 | 53.5% |
| Kings XI Punjab | Delhi Capitals | 77 | 53.2% |
| Kings XI Punjab | Rajasthan Royals | 71 | 52.9% |
| Kolkata Knight Riders | Delhi Capitals | 60 | 52.4% |
| Sunrisers Hyderabad | Royal Challengers Bangalore | 57 | 52.2% |
| Kolkata Knight Riders | Rajasthan Royals | 54 | 52.2% |
| Kings XI Punjab | Sunrisers Hyderabad | 46 | 51.8% |
| Chennai Super Kings | Mumbai Indians | 25.4 | 51.1% |
| Delhi Capitals | Sunrisers Hyderabad | -31.2 | 51.1% |
| Rajasthan Royals | Royal Challengers Bangalore | 31 | 51.1% |
| Sunrisers Hyderabad | Delhi Capitals | 31 | 51.1% |
| Kolkata Knight Riders | Sunrisers Hyderabad | 29 | 51.0% |
| Delhi Capitals | Royal Challengers Bangalore | 25.3 | 50.9% |
| Kings XI Punjab | Kolkata Knight Riders | 17 | 50.5% |
| Rajasthan Royals | Delhi Capitals | 6 | 50.0% |
| Sunrisers Hyderabad | Rajasthan Royals | 25 | 50.0% |
| Delhi Capitals | Rajasthan Royals | -5.9 | 49.5% |
| Kolkata Knight Riders | Kings XI Punjab | -17 | 49.0% |
| Royal Challengers Bangalore | Delhi Capitals | -25 | 48.6% |
| Rajasthan Royals | Sunrisers Hyderabad | -25 | 48.6% |
| Mumbai Indians | Chennai Super Kings | -25 | 48.6% |
| Sunrisers Hyderabad | Kolkata Knight Riders | -29 | 48.5% |
| Royal Challengers Bangalore | Rajasthan Royals | -31 | 48.4% |
| Sunrisers Hyderabad | Kings XI Punjab | -46 | 47.7% |
| Rajasthan Royals | Kolkata Knight Riders | -54 | 47.3% |
| Royal Challengers Bangalore | Sunrisers Hyderabad | -57 | 47.3% |
| Delhi Capitals | Kolkata Knight Riders | -60.1 | 47.1% |
| Rajasthan Royals | Kings XI Punjab | -71 | 46.6% |
| Delhi Capitals | Kings XI Punjab | -76.9 | 46.3% |
| Royal Challengers Bangalore | Kolkata Knight Riders | -85 | 45.7% |
| Royal Challengers Bangalore | Kings XI Punjab | -102 | 45.2% |
| Kings XI Punjab | Mumbai Indians | -125 | 44.2% |
| Kolkata Knight Riders | Mumbai Indians | -142 | 43.5% |
| Kings XI Punjab | Chennai Super Kings | -151 | 43.1% |
| Rajasthan Royals | Mumbai Indians | -196 | 41.1% |
| Sunrisers Hyderabad | Chennai Super Kings | -196 | 41.1% |
| Delhi Capitals | Mumbai Indians | -201.9 | 40.9% |
| Rajasthan Royals | Chennai Super Kings | -221 | 40.0% |
| Royal Challengers Bangalore | Mumbai Indians | -227 | 39.8% |
| Delhi Capitals | Chennai Super Kings | -227.4 | 38.9% |
| Sunrisers Hyderabad | Mumbai Indians | -171 | 38.2% |
| Royal Challengers Bangalore | Chennai Super Kings | -253 | 37.5% |
| Kolkata Knight Riders | Chennai Super Kings | -167 | 35.3% |

One thought on “IPL – Current Elo Rankings – Probabilities”