I previously posted an R script which plots the distribution of age at peak batting average (runs/innings) of the English team, to answer the all important question in sports performance of “when do athletes peak?”.
But due to how the game has many formats, it seems unfair to judge performance merely on when the batters’ average peaks. For instance, strike rate is a measure that predicts peak performance in the T20 and ODI format. So, I thought it only fair to write some code that used the same logic as before, but to plot the distribution of age at peak strike rate. The same inclusion criteria was used as in the previous script, and the IDs of players were pulled from the ESPN Cricinfo API to call these players into the dataset. I have changed a couple of things for the strike rate script. Firstly, my example presented in this post uses all ODI data, not just England (for any player that has played >= 20 ODIs). This code however can be used to look at data from all formats by amending the script, where fetch_player_data pulls the ID and selected format:
for(i in playerid) {
playerInfo <- cricketdata::fetch_player_data(i, “odi”)
playerInfo$id <- i
battingData <- rbind(battingData, playerInfo)
}
Secondly, the package I was using before to plot the data was identifying the mean age (for peak performance as measured by batting average), where if we were identifying where most players peaked, we would want a mode value. Therefore the latest script includes two plotting options.
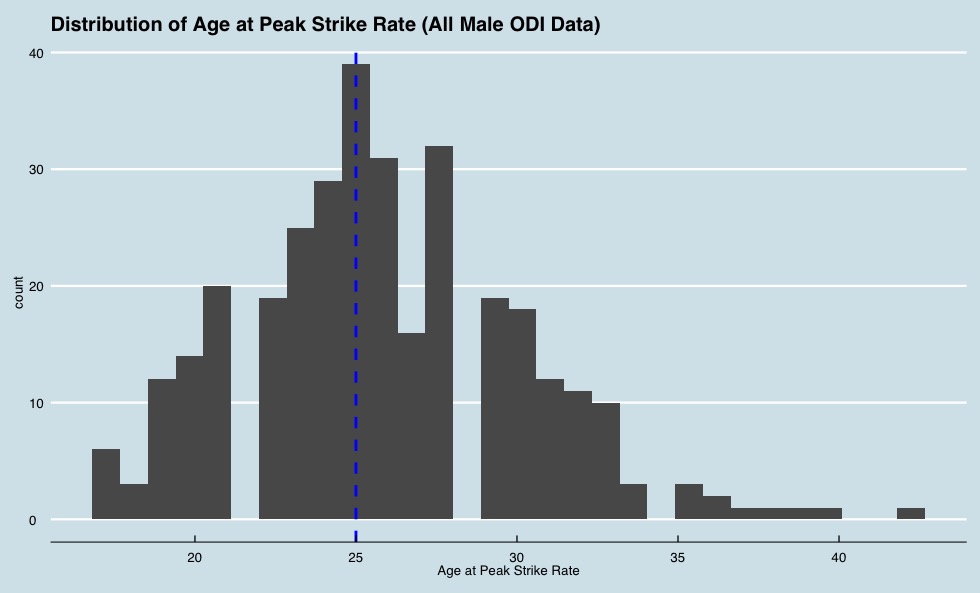
The count for each age, and the mode:
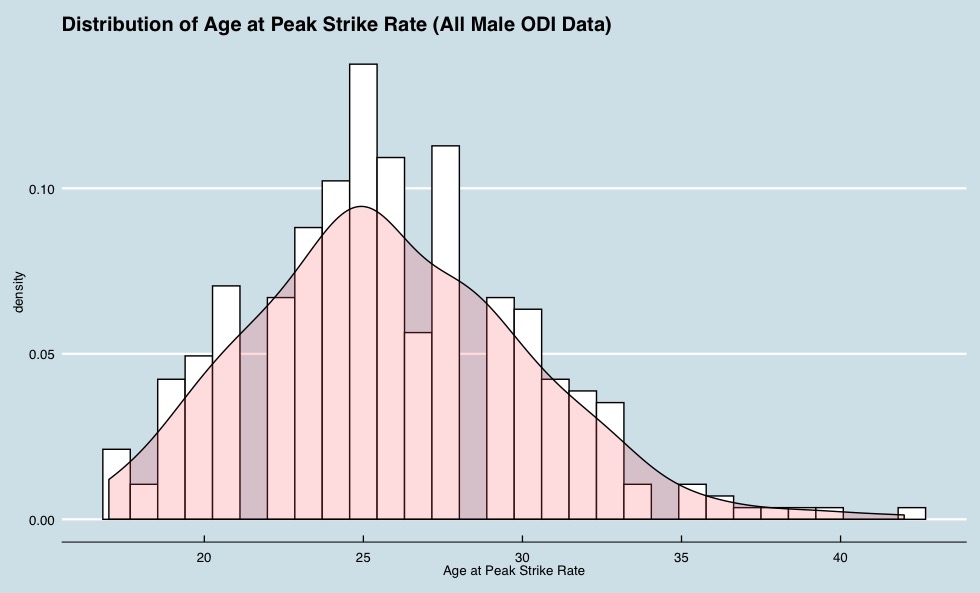
And the distribution with density:

You can grab the code here on my Github.
As usual, I’m always eager to get the opinion of my fellow analysts on how these can be developed, so don’t hesitate to get in contact with me.
