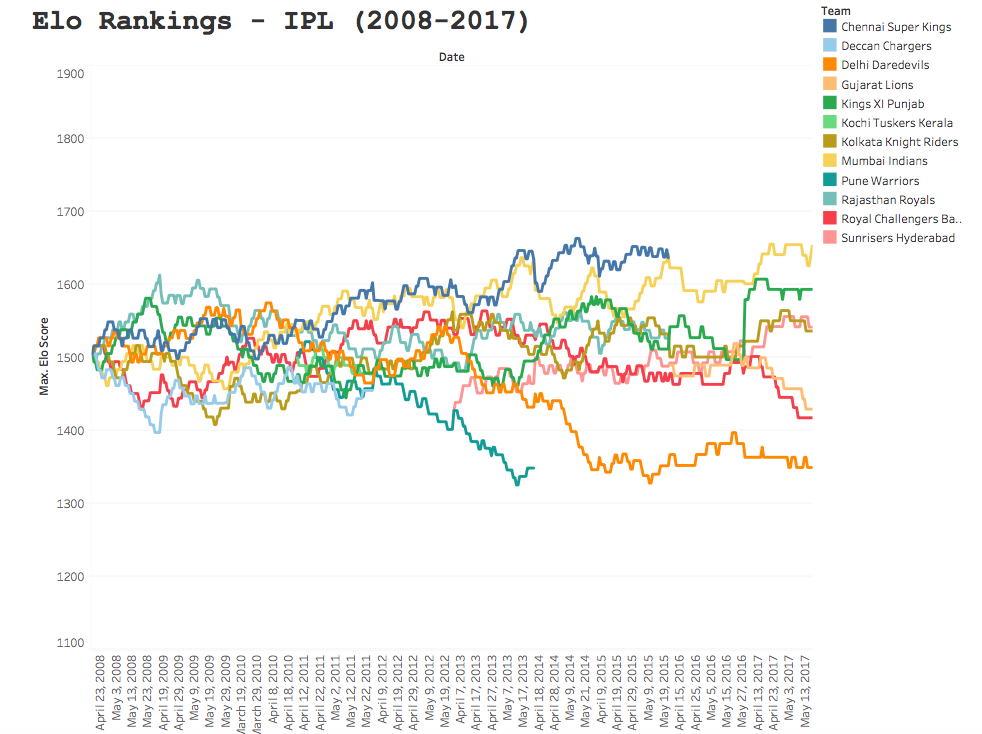
What the El’ are you on about?
Now, the visual above looks somewhat noisy. In fact, if you have never stumbled across Elo rankings before, you will think this is pure noise; and to be completely honest that’s why I’ve included it in the head of this post. We can only typically begin to synthesise discernible information from data, when we begin to segment it, break it down and find out what is driving the data. In fact, to correctly interpret Elo data, it is pivotal that you understand what is driving the output, how the team is actually performing in real life and anecdotal data can be extremely important in understanding what’s going on. After all, the betting markets make an absolute fortune from just probabilities alone, it’s essential that you take a deeper look into data, and continue to update your assumptions. But first I will explain a little bit about Elo ratings….
The reason the image above looks so cluttered and trend-less, is because Elo ratings are (typically) a highly reactive points scoring system. The system was created by Arpad Elo, a Hungarian-American physics professor who originally computed it as a method for calculating the relative skill levels of players in zero-sum games such as chess. The ranking system has since been used in a variety of sporting contexts, and since the Moneyball revolution have become ever more popular, primarily due to the fact the fact that Elo rankings have been shown to have predictive capabilities.
A teams’ Elo rating is represented by a number which either increases or decreases depending on the outcome of games between other ranked teams. After every game, the winning team takes points from the losing one. The difference between the ratings of the winner and loser determines the total number of points gained or lost after a game; this is an imperative consideration as it accounts for big upsets in sports, which can have important knock-on effects throughout the teams’ season. Although the initial number allocated to a team is somewhat arbitrary, most previous analyses have used 1505 as the starting figure.
I won’t speak in great detail about the calculation or how this is computed/implemented, for this I will leave you in the trusted hands of the guys over at FiveThirtyEight. If you aren’t a fan of implementing calculations, feel free to contact me and I will send you a template.
IPL K Value
What I will discuss is a couple of things I tweaked in my model, which are specific not just to cricket (as that would be an all too vague refinement), but to t20 cricket and the Indian Premier League (IPL) in particular. I adjusted the K value to 22; which isn’t dissimilar to the value of ~20 used for FiveThirtyEight’s NBA model. This is intuitive as – similar to the NBA – winning and/or losing streaks are not just prominent, but highly indicative of how the team is actually playing in the IPL. The K value mediates the sensitivity to recent game changes to account for this. For sports like baseball, where there is a high degree of luck where game-by-game results are fairly noisy and your default assumption should be that a winning or losing streak is mostly good or bad fortune, streaks in IPL performance may reflect honest, if perhaps temporary, adaptations in team quality.

Previous season weighting
Now, instead of refreshing Elo scores at the start of every season (which would make little sense), a weighting is typically applied at the beginning of the season depending on how the team finished in the previous season. In the context of the NBA, the team carries over 3/4’s of its Elo from the previous year, which I felt inappropriate for an IPL model. Now despite NBA rosters varying from year to year for each team – with a fairly busy transfer window – the IPL has a fairly unique format. Rosters in some cases are completely altered from the previous year, with players frequently swapping between teams, so it would be unfair to provide a team with a handicap that has not maintained at least most of the same personnel. For the V1 of my model, I used a 60% carry-over, but of course this is a process of refinement and if I see the need to adjust this percentage I will alter the threshold.
V1 of my model
In times to come, I will build out some predictions off the back of the model I’ve created, but as it stands I have only located data till the end of the 2017 IPL campaign; so will address this in V2. I will however, present some interesting findings. If you want to have a play around with the Tableau visual I made, feel free; and if you’re a fellow analyst, statistician or you’re just a cricket fanatic that thinks the model could do with refinement – please don’t hesitate to contact me.
Rajasthan Royals
The Royals’ Elo ranking peaked after their winning season in 2008, at 1605.5 points. Since then they have reached the playoffs three times, but failed to make the final. Their seamless performance (no pun intended) in their winning season, can be seen by the steep gradient during the 2008 campaign; where they lost only three games. Sadly since then, Rajasthan have been somewhat of a yoyo team and struggled to find their feet.

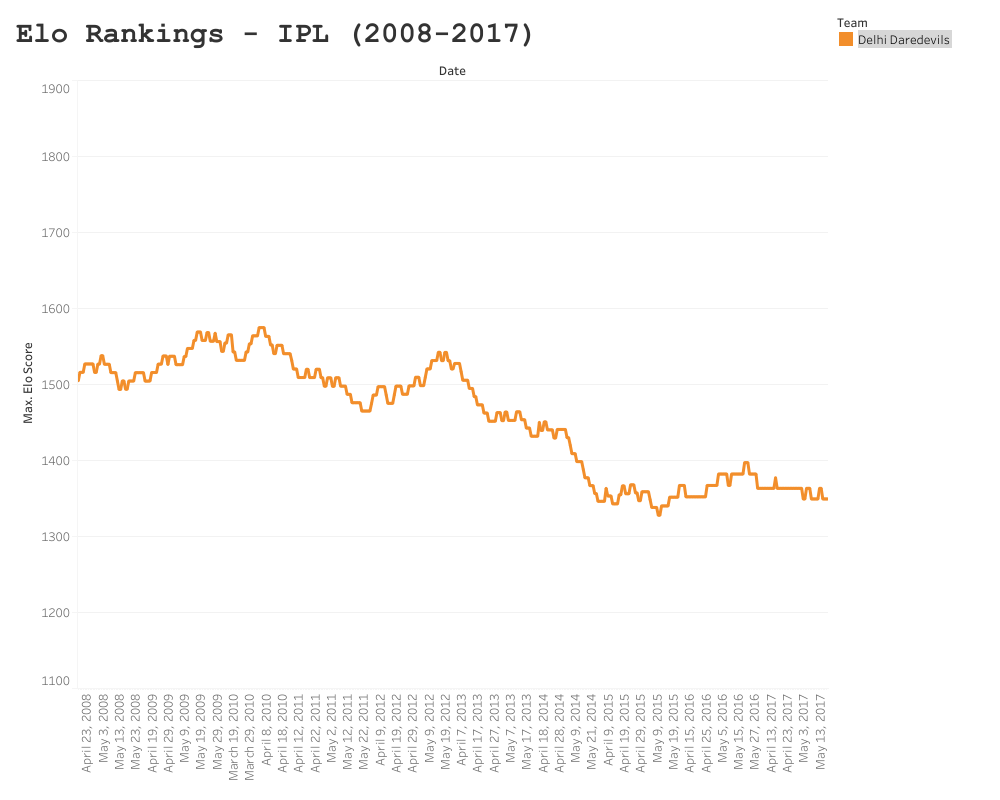
Delhi Daredevils/Capitals
As team rosters vary from year to year so much, teams can struggle to pick up where they left off in relation to the prior season. Once such team who have continued to struggle in the IPL is the Delhi Daredevils (now known as the Capitals). Delhi has experienced minor peaks in Elo, such as semi final placings in 2012, but have been on average the worst performing and least consistent team since the IPL’s inception in 2008.
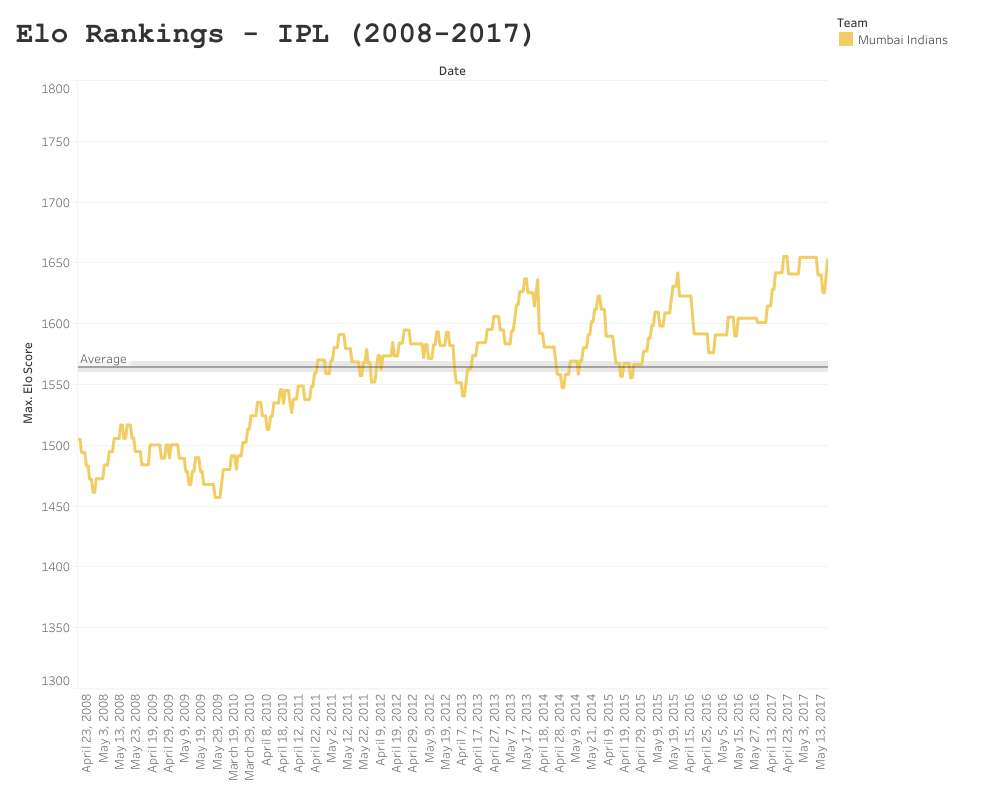
Mumbai Indians
As previously mentioned, due to the changes in roster from season to season, consistency can be somewhat problematic in the IPL, which is why I applied a lower season-to-season weighting in my model, as it is often like a fresh start each season. However, this somewhat turbulent variance between seasons makes the performance of the Mumbai Indians even more impressive – who won three times within this collection period, averaging an Elo score of ~1560, and an apparent linear increase in performance since 2008. Mumbai have been a bit more fortunate with maintaining players from season to season, but these findings suggest that something else is happening behind closed doors. If you have watched the Netflix series Cricket Fever (and I urge that you do), you can see that Mumbai are a well oiled machine, taking things like strength and conditioning, rehabilitation and club economics very seriously. Of course not every team had a Netflix crew documenting their processes, but when you observe the consistency Mumbai have maintained, despite the “yoyo” nature of the league – you have to start to consider variables effecting their performance and consequently your statistical modelling.
I won’t present anymore individual trends in this report; mainly so you can have a play around with the dashboard; but also because this is a V1 of my IPL model. Before I present V2, I will include all data (till 2019) in my model. After this, I will start to make some predictions for the 2020 campaign based off of my Elo rankings, which are going to undergo constant refinement. I’m in the fortunate position where I can consult analysts at the BBC, who may have some useful intel or insight that will require me to tweak my model. As Elo is an inherently Bayesian system, it only seems fair that I adjust my own assumptions and iterate the model.
